project · finished · Python
Finding pulsars in noise
Classifying HTRU2 radio candidates as pulsars or noise, where only 9% of the data are real pulsars.
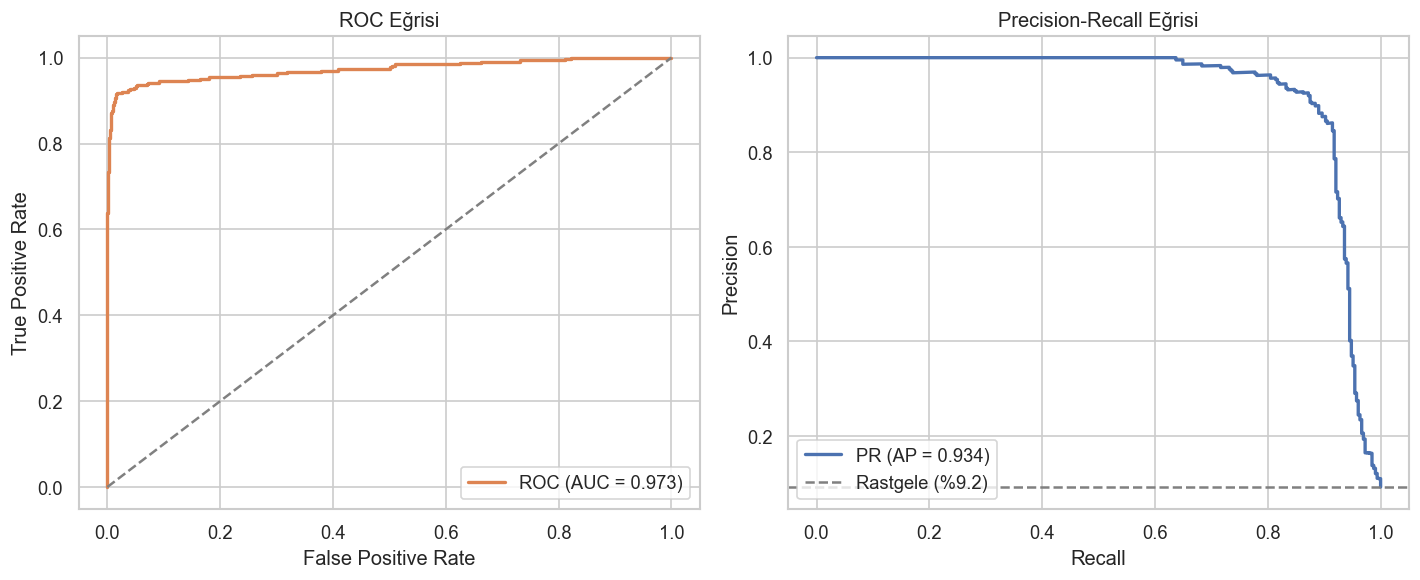
result Logistic regression recovers 92% of the real pulsars in the test set (recall 0.92, PR-AUC 0.934) — on data where predicting "no pulsar" every time would already score 91% accuracy.
Bootcamp final project. Radio telescopes record millions of candidate signals; almost all are radio-frequency interference or noise. The question: can the statistics of a signal tell you whether it is a real pulsar?
Problem
The HTRU2 dataset (High Time Resolution Universe survey, via UCI) has 17,898 candidates, each described by eight numbers — the mean, standard deviation, excess kurtosis and skewness of two curves: the integrated pulse profile and the DM–SNR curve. Only 9.16% are real pulsars.
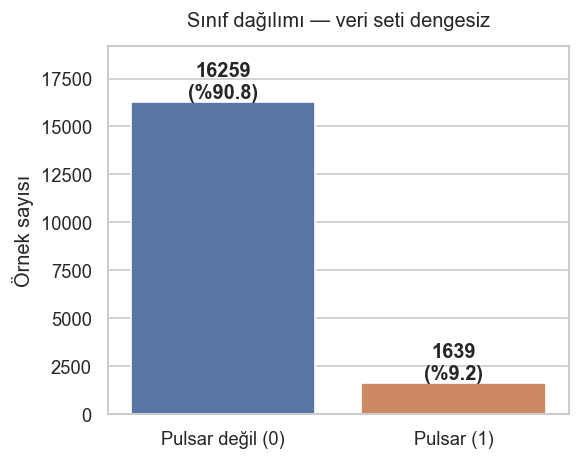
That imbalance is the whole story. A model that always says “not a pulsar” scores 91% accuracy and finds nothing. So the metrics that matter are recall (how many real pulsars did I catch?) and precision–recall AUC.
Method
- Stratified train/test split, so the 9% pulsar fraction is preserved in both halves.
StandardScalerfitted on the training set only — fitting on everything would leak test information into the model.- Logistic regression with
class_weight="balanced"as an interpretable baseline, then a random forest for comparison.
Results
| Metric (pulsar class) | Logistic regression | Random forest |
|---|---|---|
| Precision | 0.78 | 0.92 |
| Recall | 0.92 | 0.86 |
| F1 | 0.85 | 0.89 |
| PR-AUC | 0.934 | 0.925 |
The two models make different trade-offs. Logistic regression catches more pulsars; the random forest raises fewer false alarms. Which one is “better” depends on what a missed pulsar costs compared with a wasted follow-up observation.
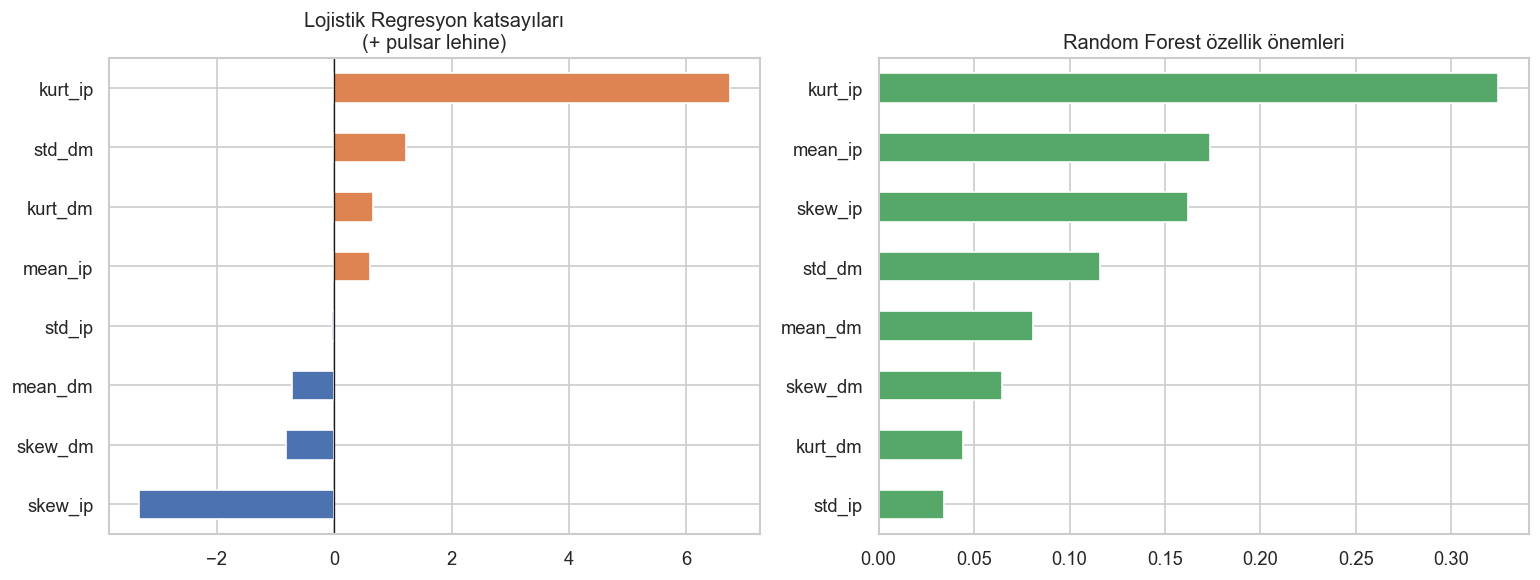
Both models agree on what matters: the kurtosis and skewness of the integrated profile. A real pulsar’s folded profile is a sharp, asymmetric spike; noise is not.
Limitations
- The decision threshold was left at 0.5; tuning it along the precision–recall curve is the obvious next step.
- No hyperparameter search and no resampling (e.g. SMOTE) yet.
- Eight summary statistics throw away most of the raw signal — a model on the full profiles might do better, and would be harder to interpret.